top of page

Create account
+91 96113 44773
Search
Vijay Perepa
Mar 21, 20221 min read
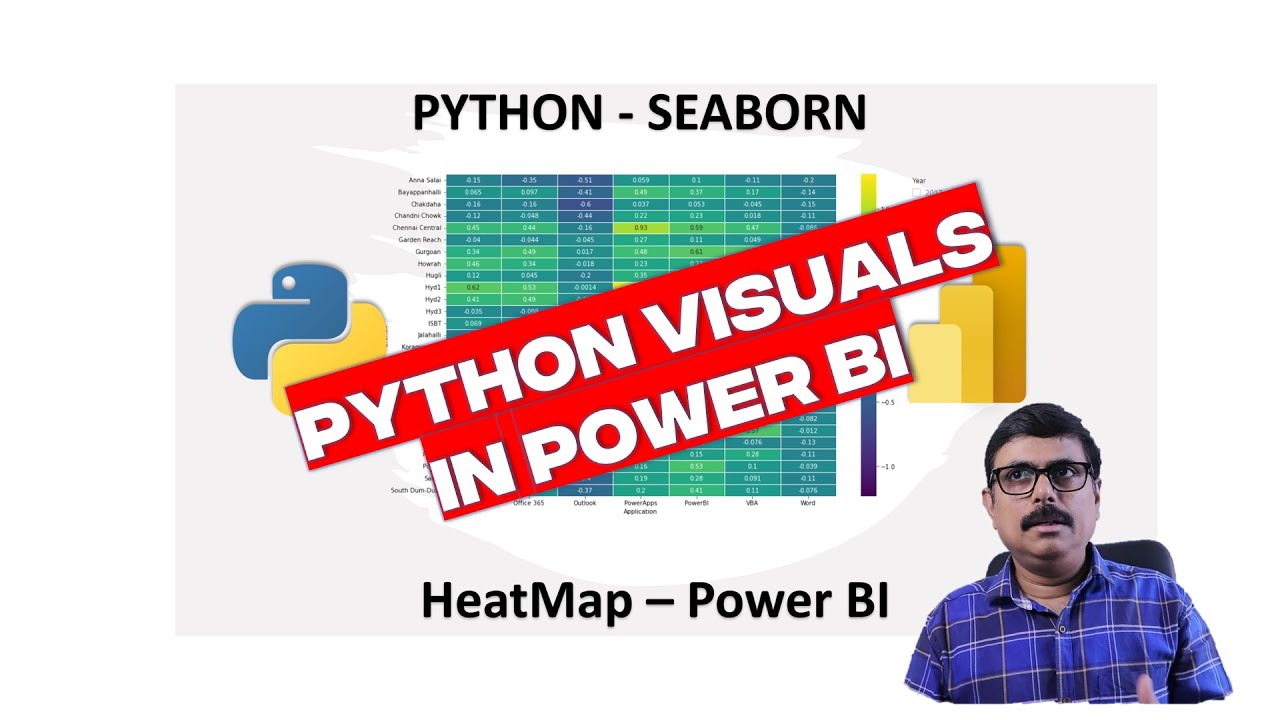
𝐏𝐨𝐰𝐞𝐫 𝐁𝐈 || 𝐏𝐲𝐭𝐡𝐨𝐧 || 𝐒𝐞𝐚𝐛𝐨𝐫𝐧 || 𝐇𝐞𝐚𝐭𝐦𝐚𝐩 || 𝐂𝐮𝐬𝐭𝐨𝐦 𝐕𝐢𝐬𝐮𝐚𝐥𝐬
You can create custom visuals in Power BI Desktop / Service by using Python packages very easily . I am coming up more videos to explain...
75 views0 comments
Vijay Perepa
Aug 11, 20211 min read
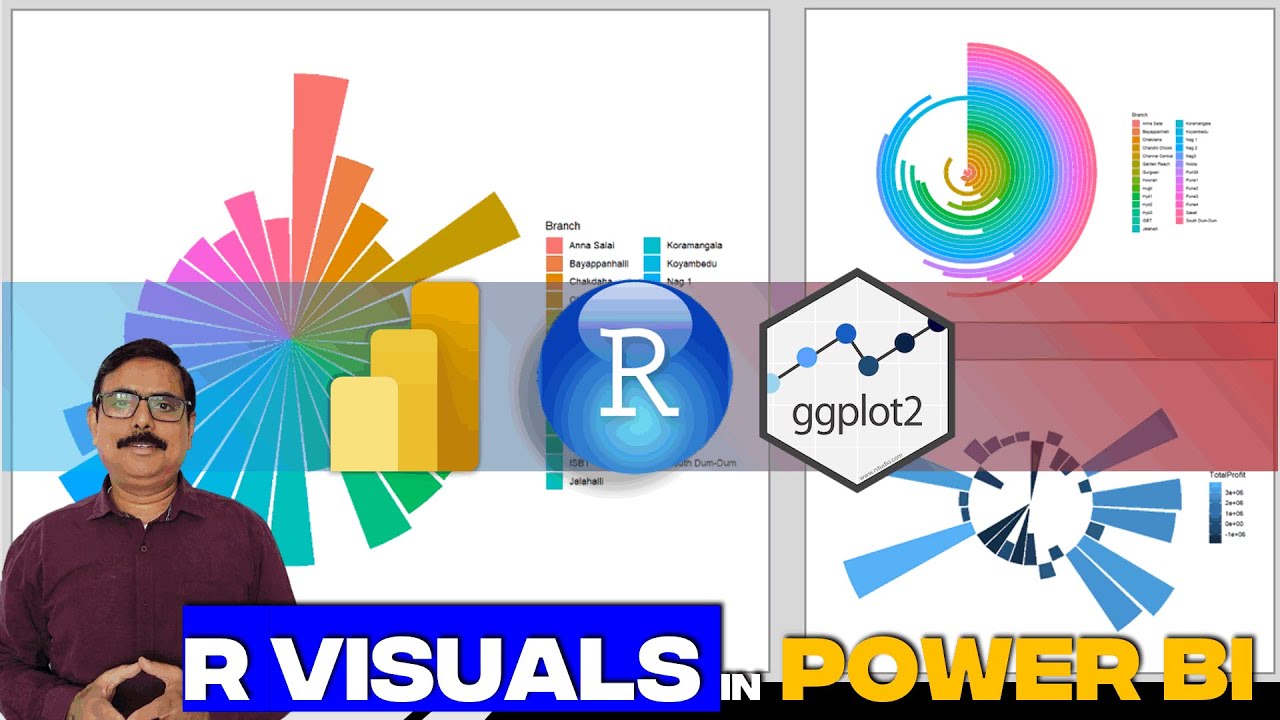
𝐂𝐢𝐫𝐜𝐥𝐞 𝐏𝐨𝐥𝐚𝐫 𝐕𝐢𝐬𝐮𝐚𝐥𝐬 𝐢𝐧 𝐏𝐨𝐰𝐞𝐫 𝐁𝐈 𝐮𝐬𝐢𝐧𝐠 𝐑 𝐕𝐢𝐬𝐮𝐚𝐥𝐬
Tried using Polar Char in place of Pie/Donut Chart to show case the data of multiple variables. Pie / Donut don't support both positive...
333 views0 comments
bottom of page