top of page

Create account
+91 96113 44773
Search

Vijay Perepa
Dec 1, 20201 min read
Hide and Unhide Pivot Table Slicers
When you are working with Pivot Tables , Slicers plays very important Role. They help us to filter data of All pivot Tables / Charts with...
93 views0 comments
Vijay Perepa
Nov 29, 20201 min read
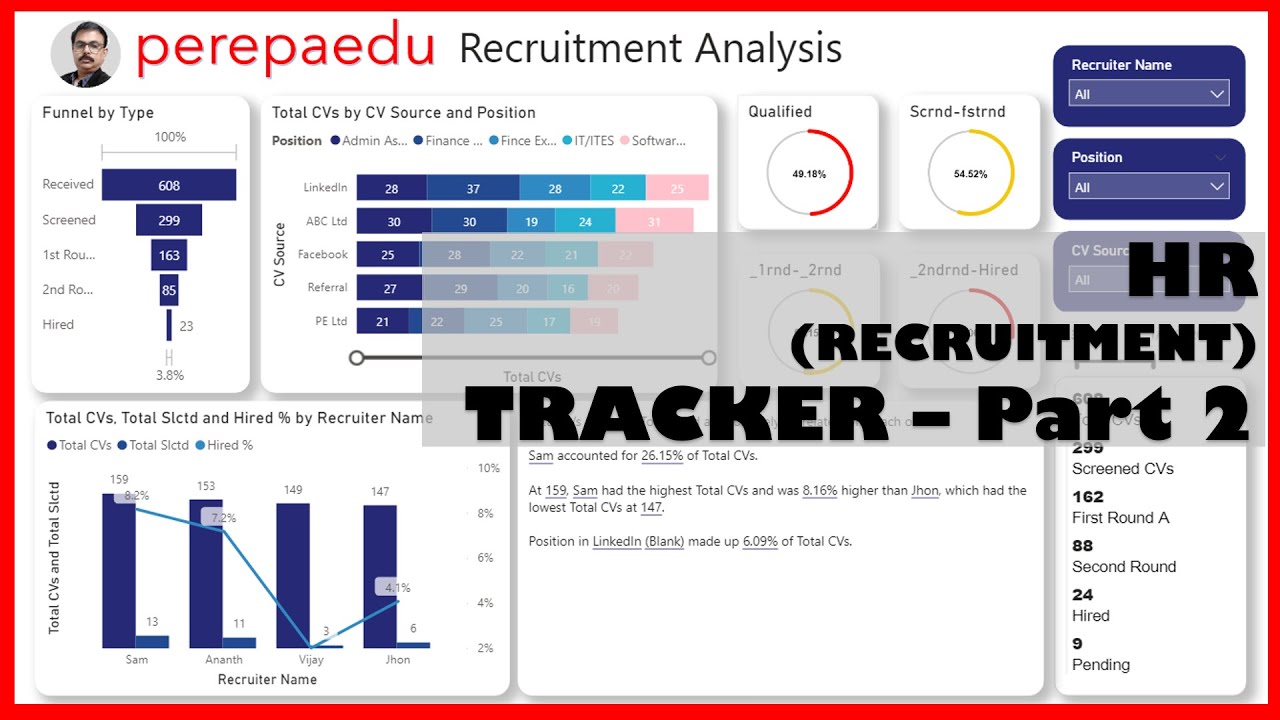
HR Recruitment Analysis Part 2 Data Modelling, DAX, Report Preparation in Power BI
HR - Recruitment Tracker - Creating Report using Power BI. In this Video a I have explained how to create a recruitment tracker using...
629 views3 comments
Vijay Perepa
Nov 28, 20201 min read
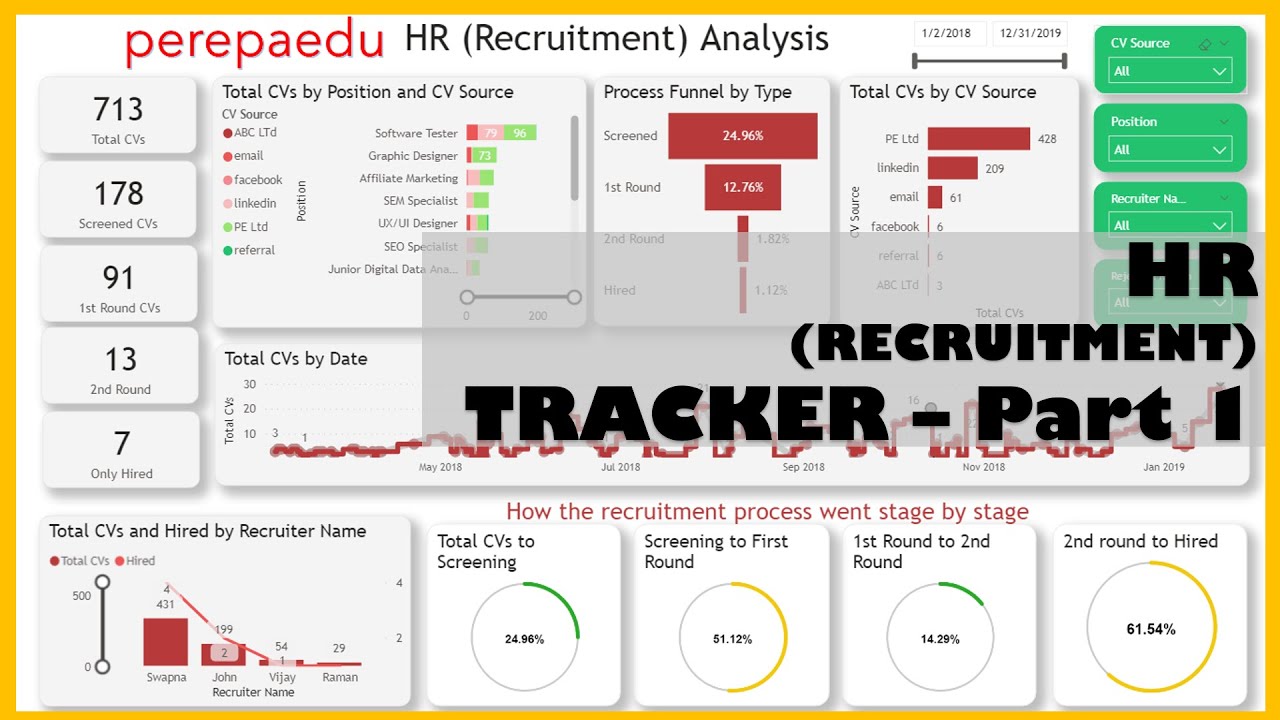
HR Recruitment Tracker (Analysis) Part 1 Dataset Creation
#PowerBI#HRAnalytics#RecruitmentTracker#PowerBIDesktop Most Common question is from any Power BI user , "How to Practice and how to get...
564 views0 comments


Vijay Perepa
Oct 23, 20201 min read
CSV file 1.5M Records - Analyze data in Excel using Python
Have you tried using Python for Quick work in Excel or CSV. Watch this Video. I have explained how to Store data of CSV into Excel...
158 views0 comments
Vijay Perepa
Oct 22, 20201 min read
Wish to Learn Python with Excel ?
Python - is Powerful - is Fast - Can be integrated with many applications - Runs everywhere - Very friendly & easy to learn; - Most...
217 views0 comments

Vijay Perepa
Oct 20, 20201 min read
Power BI Oct 2020 Updates Personalized Visuals
What is Personalized Visual. When this feature was introduced. What is new in Personalized visuals in Oct 2020 Update. To know about...
114 views0 comments
Vijay Perepa
Oct 20, 20201 min read
Power BI Updates - Filter Pane Features
While working with Filter Pane, you can have more options to make it much clear and interesting to make it standout. While using many...
93 views0 comments
Vijay Perepa
Oct 20, 20201 min read
Power BI Desktop - Oct 2020 Updates - What I Liked most Part 1
In the Latest update of Power BI Desktop (Oct 2020 ), few features I liked very much. I have shared my views . - New Logo - New Interface...
179 views0 comments

Vijay Perepa
Oct 18, 20201 min read
How to Create infographics in Power Point
Watch this Video to know how quickly you can use Shapes to convert into an nice infographics
376 views0 comments
Vijay Perepa
Oct 15, 20201 min read
Normalizing Complex Excel Data using Power Query M Language - Learn Power Query - Part 8
Some you may get bit complex Data in Excel. The Data with Merged Cells, Blanks, Multiple Column Headers, Some Time Data Title as Column...
238 views0 comments
Vijay Perepa
Oct 13, 20201 min read
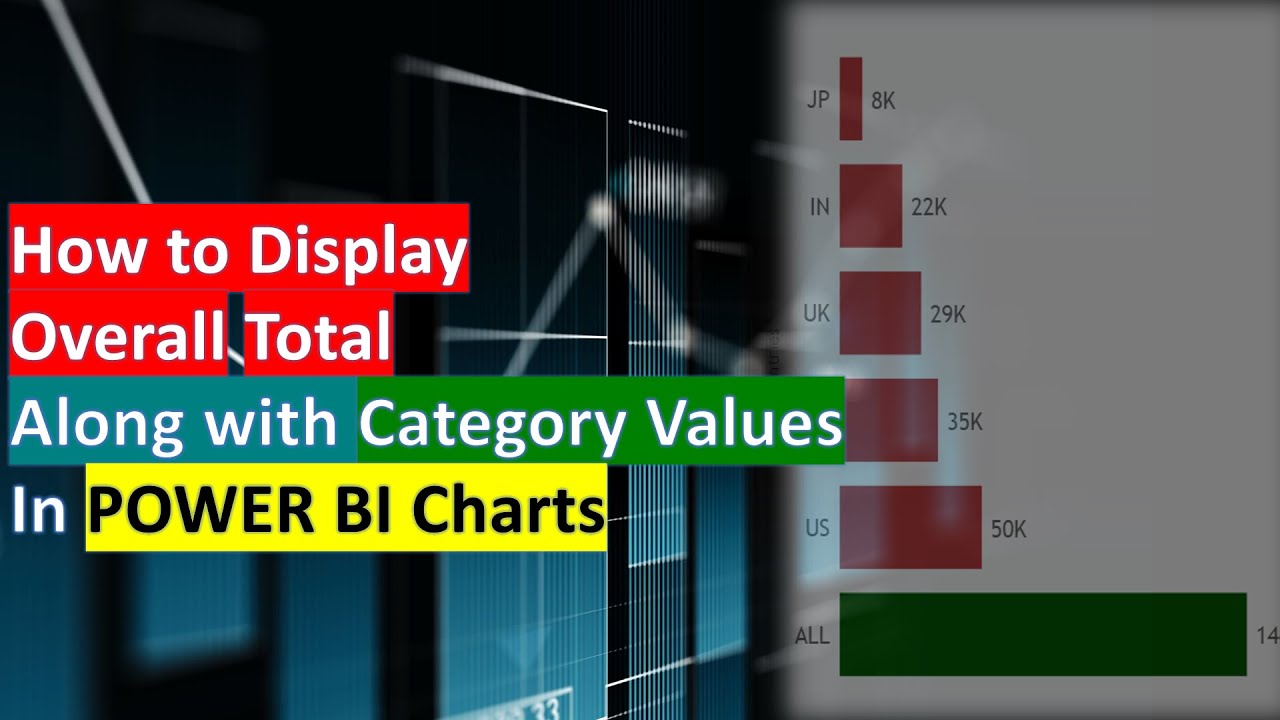
How to Display Overall Total along with Category in a Viz - Learn Power Query - Part 7
While Presenting Any Report you must keep the Audience in view because they are your customers and you need to incorporate their...
188 views0 comments


Vijay Perepa
Oct 10, 20201 min read
Pivot Tables with VBA - New Video Series
New #VBA #Series is Coming up! Please be the #member of www.perepaedu.com and Subscribe to www.youtube.com/perepavijay Keep watching for...
36 views0 comments

Vijay Perepa
Oct 4, 20201 min read
How to Manage Visuals while using Filters in Power BI
Some times, even after applying Page / Report Level Filters, we may require few visuals should not interact with that Filter and they...
89 views0 comments
Vijay Perepa
Oct 2, 20201 min read
Learn Power Query Part 6 - Using Table Functions
M Query is a Functional Language. While Transforming Data in Power Query knowledge of Table Functions and other Functions is an added...
160 views0 comments

Vijay Perepa
Oct 1, 20201 min read
Learn Power Query - Part 5 - How to use M Query Language
Start Applying M Query and Understanding the Logic In this video few common functions are explained Keep watching! 😎
122 views0 comments

Vijay Perepa
Sep 29, 20201 min read
Learn Power Query and Power Query Editor - Part 4 Understanding M Language A Functional Language
Power Query is the Data Transformation engine which can be used in many applications, and Power Query Editor is the Graphical User...
126 views0 comments
Vijay Perepa
Sep 28, 20201 min read
Learn Power Query - Part 3, Creating Quick Dashboard in Excel
In this Video , I have Explained how to create a very quick video using the Power Query Model in Excel. How to create a Custom Column in...
44 views0 comments
Vijay Perepa
Sep 28, 20201 min read
Learn Power Query and Power Query Editor - Part 1
As promised, I have started the Series - Learn Power Query and Power Query Editor. What is the difference between these two?! Power Query...
141 views0 comments

Vijay Perepa
Sep 27, 20201 min read
Power Query Editor - A Complete Course Online
Power Query is a data transformation and data preparation engine. Power Query comes with a rich GUI for getting data from different...
485 views0 comments
bottom of page