top of page

Create account
+91 96113 44773
Search

Vijay Perepa
Sep 24, 20201 min read
How to create a Complete Report using DAX and Slicers in Power BI
I have create a Playlist with 6 Videos showing how to create a comprehensive report using Simple DAX Functions. Also Explained how to...
343 views0 comments


Vijay Perepa
Sep 16, 20201 min read
How to Create Measure Table and Folders inside in Power BI Desktop
Managing and Staging Measures in a Proper Folders is one of the best Practices in Report building in Power BI. Please watch to know how...
104 views0 comments

Vijay Perepa
Sep 15, 20201 min read
How to Custom sort in Excel Sort data using a custom list
In Excel, you can quickly sort your data by using the A-Z and Z-A Sort buttons on the Ribbon's Data tab. Also you can Sort Data in a...
56 views0 comments

Vijay Perepa
Sep 14, 20201 min read
How to Create Ageing Analysis in Power BI
During one of Training Programs few participants are from Finance (predominantly, who deal with Receivables and Payables) , asked about...
1,102 views0 comments

Vijay Perepa
Sep 12, 20201 min read
How to add Animated Icons into Power BI Conditional Formatting
During one of my regular workshops , one participant asked whether he can add any animated pictures viz., gifs etc. instead of regular...
1,045 views0 comments

Vijay Perepa
Sep 12, 20201 min read
How to Create BUTTERFLY (Tornado, Pyramid) Chart
While Analyzing Data using Excel, Sometimes we require some Extra customized Charts to help us to tell the story of the data,much more...
99 views0 comments

Vijay Perepa
Sep 11, 20201 min read
How to import Data from Google Sheets to Excel / Power BI
How to import and Get connected Google Sheets to Excel. A simple Trick helps us to import Google Sheet Data to Excel . Also How to use...
123 views0 comments

Vijay Perepa
Sep 9, 20201 min read
Drill DOWN with Hierarchy in Power BI and using Book Marks
How to use Drill Down With Hierarchy in Power BI , also use Book Marks to make the Visual Impact much Better !To know how to manipulate...
248 views0 comments
Vijay Perepa
Aug 30, 20201 min read
How to get Totals Based on Cell Color Creating / UDF (User Defined Functions) with VBA
Some times we requires some Special or Customized Functions in Excel but we may not get them. For Example if you want get Total Values,...
95 views0 comments

Vijay Perepa
Aug 29, 20201 min read
Interactive Chart with INDIRECT Function and Named Ranges
Creating Reports with Excel Charts is quite Easy and Effective. Whenever we create a Chart in Excel we need to keep in view the end...
64 views0 comments
Vijay Perepa
Aug 28, 20201 min read
Scenario Planning : Foreseeing how your big picture could change, so you can get the details right
Register Now https://valq.com/webinars/scenario-planning-foreseeing-how-your-big-picture-could-change-so-you-can-get-the-details-right/
20 views0 comments

Vijay Perepa
Aug 28, 20201 min read
One Chart Many Colors - Chart Hierarchy with Conditional Formatting (Toggle Chart)
Some time you wish you have different colors for each month and Years in a Chart where the Axis is shared by both Year and Month (Chart...
137 views0 comments

Vijay Perepa
Aug 27, 20201 min read
How to Clean Excel Workbook to avoid unused sheets
While working on Excel Files, many times due to various reasons you may find many sheets piled up containing sheets which are really not...
59 views0 comments

Vijay Perepa
Aug 27, 20201 min read
Learn DAX - TOPN - Dynamic Selection
DAX Functions give us a great Scope to get the insights from the Large Datasets. A simple functionality will allow us to get multiple...
115 views0 comments
Vijay Perepa
Aug 26, 20201 min read
How to Create Custom Tool Tip with Dynamic Image
While visualizing data in Power BI Report if you wish to have any picture which is relevant to data with a filter context in the Visual (...
182 views0 comments

Vijay Perepa
Aug 26, 20201 min read
How to Create Animated SUNBURST CHART
A Sunburst Chart is used to visualize hierarchical data, depicted by Multiple Donut Chart Layers. The circle in the center represents the...
140 views0 comments

Vijay Perepa
Aug 26, 20201 min read
How to create Dynamic Date Table in Power BI
A Common Question by many Power Beginners that how to have a Fiscal Quarter and Fiscal Year Fields on the basis of Fiscal Calendar in...
102 views0 comments

Vijay Perepa
Aug 25, 20201 min read
Power BI Sample Report
We are providing a free sample to all our registered members to access and download and try, shortly. A Complete report showing...
23 views0 comments
Vijay Perepa
Aug 24, 20201 min read
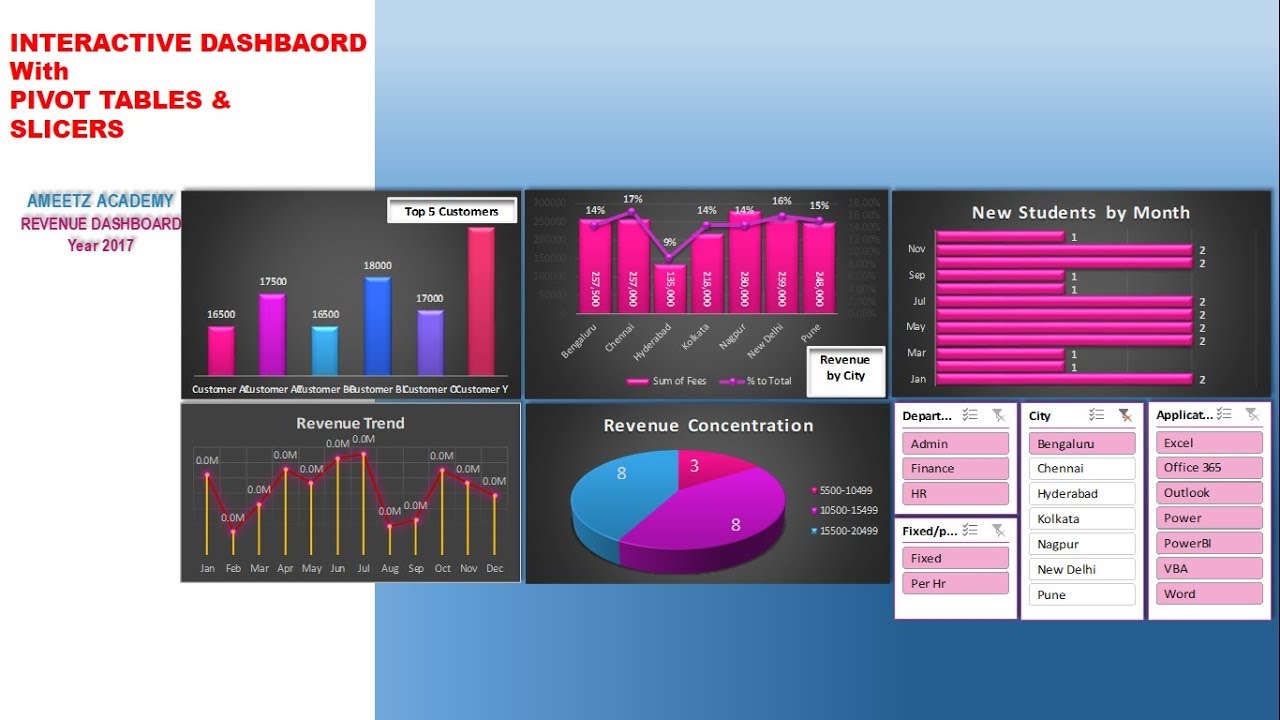
How to create Complete Excel Dash Board in 15 minutes
Why you use Excel? The answer from many Excel users is - "We create Reports / Dashboards" But the creation of reports by using Formulae...
618 views2 comments
bottom of page